
 PDF Download
 PubReader
 Export Citation
 Email the Author
 Share Facebook
 Share Twitter
 Cited by 0 Article
 Metrics (View:1)









Introduction
Carotenoids contribute to the coloration of agricultural products and perform photoprotective functions in photosynthetic tissues (Stahl & Sies, 2003; Maoka, 2020; Sun et al., 2022). As these compounds cannot be synthesized in the human body, their continuous intake through the diet is required, highlighting their nutritional importance (Eggersdorfer & Wyss, 2018). Some carotenoids function as provitamin A precursors, contributing to visual function and immune regulation (Tanumihardjo, 2011; Moran et al., 2018). In addition, their molecular structures, characterized by conjugated double bonds, enable efficient scavenging of reactive oxygen species, thereby exerting strong antioxidant activity (Krinsky & Johnson, 2005; Kaulmann & Bohn, 2014). These structural properties are closely associated with their ability to inhibit lipid oxidation and contribute to membrane stability (Widomska & Subczynski, 2014). Due to their lipophilic nature, carotenoids tend to accumulate in biological membranes and lipid-rich tissues, which may be associated with tissue-specific functions (Maiani et al., 2009). Moreover, different carotenoids exhibit distinct physiological roles and distribution patterns in the human body (Bohn, 2019). For instance, lutein and zeaxanthin are selectively accumulated in ocular tissues (Bernstein et al., 2016), whereas β-carotene and β-cryptoxanthin are recognized as major dietary sources of provitamin A (Tanumihardjo, 2011). In contrast, carotenoids such as lycopene do not possess provitamin A activity, but have been associated with various health benefits due to their strong antioxidant capacity (Story et al., 2010). These diverse properties have motivated studies examining the occurrence and concentrations of individual carotenoids in foods (Kurek et al., 2025). Carotenoid profiles among agricultural food products differ according to plant species, tissue characteristics, biosynthetic pathways, and storage forms. Furthermore, even for the same carotenoid, bioavailability and stability may differ according to the food matrix and structural characteristics, which can ultimately influence their nutritional contribution upon consumption (Yan et al., 2024; Zhang et al., 2024). Processing and thermal treatment have also been reported to induce isomerization and degradation of carotenoids, leading to changes in their content and composition (Meléndez-Martínez et al., 2022). Comparisons across food categories should therefore consider which carotenoids are present, their concentrations, and their compositional profiles to support the evaluation of the nutritional value of foods (Fraser & Bramley, 2004). Previous studies have primarily focused on vegetables with relatively high carotenoid contents, with emphasis on variations due to cultivar, cultivation conditions, and processing (Khoo et al., 2011). However, in actual dietary patterns, a wide range of plant-based foods are consumed beyond these specific categories, and these foods may also serve as potential sources of carotenoids (Dias et al., 2021). In particular, tubers, legumes, and teas represent commonly consumed plant-based food categories with different characteristics and processing forms, yet information on their carotenoid contents and compositional profiles remains limited (Yoon et al., 2012). Compositional data of commonly consumed foods are fundamental resources for nutritional research. Therefore, there is a need to establish carotenoid databases reflecting real dietary consumption (Delgado et al., 2021; Dunlop et al., 2025). Accordingly, the present study aimed to analyze seven major carotenoids in tubers, legumes, and teas commonly consumed in Korea, and to compare their composition, content, and distribution patterns among food categories. This study may provide fundamental data on the distribution and composition of carotenoids in commonly consumed food categories in Korea and is expected to contribute to future research on food category-based carotenoid profiles.
Materials and Methods
Freeze-dried agricultural products consisting of nine types of tubers, fourteen types of legumes, and one tea sample (Camellia sinensis, green tea, dried powder) were provided by the National Institute of Crop and Food Science (Wanju, Republic of Korea). Freeze-dried Gujeolcho tea and chamomile tea were provided by Kyungsung University (Busan, Republic of Korea). Dried Gujeolcho flowers were lyophilized and the chamomile tea was prepared by infusion in boiling water for 1 min before freeze-drying. Chrysanthemum tea was additionally purchased, freeze-dried at –60°C for at least 48 h, and ground into powder using a food mixer HMF-1600PB (Hanil Electric Co., Ltd., Seoul, Republic of Korea). All samples were stored at –55°C until analysis.
Standards of α-carotene and β-cryptoxanthin, together with trans-β-apo-8′-carotenal used as the internal standard, were supplied by Sigma-Aldrich Co. (St. Louis, MO, USA). Lutein, β-carotene, and zeaxanthin were sourced from Extrasynthese Co. (Genay, France), while the (9Z)- and (13Z)-β-carotene standards were obtained from CaroteNature (Ostermundigen, Switzerland). The 7.5 M ammonium acetate solution used for mobile-phase preparation, ascorbic acid added to limit oxidation, and dichloromethane were purchased from Sigma-Aldrich Co. (St. Louis, MO, USA). HPLC-grade methanol and methyl tert-butyl ether were supplied by Duksan (Seoul, Republic of Korea) and Fisher Chemical (Waltham, MA, USA), respectively. HPLC-grade water and n-hexane were obtained from Honeywell (Charlotte, NC, USA), whereas HPLC-grade ethanol and toluene were obtained from Daejung Chemical (Seoul, Republic of Korea). Potassium hydroxide was supplied by FUJIFILM Wako Pure Chemical Corporation (Osaka, Japan).
Individual carotenoid standards were dissolved in methanol: dichloromethane (50:50, v/v) to prepare stock solutions at 500 μg/mL and stored at –20°C. Calibration solutions covering 0.049–25 μg/mL were prepared by mixing and diluting the stock solutions with the same solvent. Each calibration solution contained 10 μg/mL of trans-β-apo-8′-carotenal as the internal standard (IS).
Carotenoid extraction was performed using a modified procedure based on Park et al. (2014). Freeze-dried samples were heated in 3 mL of ethanol containing 0.1% (w/v) ascorbic acid at 85°C for 5 min. Saponification was carried out by adding 120 μL of 80% (w/v) potassium hydroxide and maintaining the mixture at 85°C for another 10 min. After cooling on ice for 5 min, 100 μL of internal standard solution (25 μg/mL), 1.5 mL of deionized water, and 0.75 mL each of hexane and toluene were added. The mixture was vortexed and centrifuged at 1,200×g for 5 min at 4°C. The lower phase was extracted again using the same volumes of hexane and toluene, followed by centrifugation as described above. The organic fractions recovered from both extractions were pooled and partially concentrated under nitrogen with an MGS-3100 gas-blowing concentrator (EYELA, Tokyo, Japan). The concentrate was then transferred to a 2 mL microtube, and the residual solvent was removed using a CVE-3000 centrifugal evaporator (EYELA, Tokyo, Japan). The dried extract was dissolved in 250 μL of methanol:dichloromethane (50:50, v/v) and filtered through a 0.5 μm hydrophobic PTFE syringe filter (Advantec, Tokyo, Japan) before HPLC analysis. The resulting solution contained the internal standard at a final concentration of 10 μg/mL.
Carotenoids were analyzed using a modified reversed-phase HPLC method based on Park et al. (2014). An Agilent 1260 Infinity II system (Agilent Technologies, Santa Clara, CA, USA), equipped with a diode array detector, autosampler, column oven, and degasser, was used with a C30 analytical column (250 mm×4.6 mm, 3 μm; YMC Co., Ltd., Kyoto, Japan) and a Symmetry C18 guard column (3.9 mm×20 mm, 5 μm; Waters, Milford, MA, USA). The HPLC system included an autosampler, diode array detector (DAD), column oven, and degasser. Carotenoid separation was carried out using two eluents: methanol/water (92:8, v/v) supplemented with 10 mM ammonium acetate as mobile phase A and methyl tert-butyl ether as mobile phase B. The gradient elution conditions were set as follows (A/B, %): 90/10 at 0 min, 83/17 at 20 min, 75/25 at 29 min, 30/70 at 35 min, 30/70 at 40 min, 25/75 at 42 min, 90/10 at 45 min, and 90/10 at 55 min. The analysis was conducted at a flow rate of 1.0 mL/min with the column maintained at 40°C and an injection volume of 20 μL. Detection was performed at 450 nm. Carotenoid identities were established by comparing analyte retention times with those of authentic standards and examining their co-elution behavior. Seven carotenoids were quantified using calibration curves prepared from authentic standards at ten concentration levels (0.049–25 μg/mL). For each analyte, the calibration curve was constructed from the ratio of its peak area to that of the internal standard (IS), trans-β-apo-8′- carotenal, which was maintained at 10 μg/mL. Calibration curves for each carotenoid were constructed in triplicate. The limits of detection (LOD) and quantification (LOQ) were calculated using the equations LOD=3.3σ/S and LOQ=10σ/S, respectively, where σ represents the standard deviation of the y-intercepts of the three calibration curves and S represents their mean slope.
Quantitative analysis of carotenoids was performed in triplicate. Data are expressed as the mean±standard deviation (SD). For soybean samples, the effects of cultivar and processing treatment on lutein content were evaluated using two-way analysis of variance (ANOVA), followed by Tukey’s multiple comparison test. Differences were considered statistically significant at p<0.05.
Results and Discussion
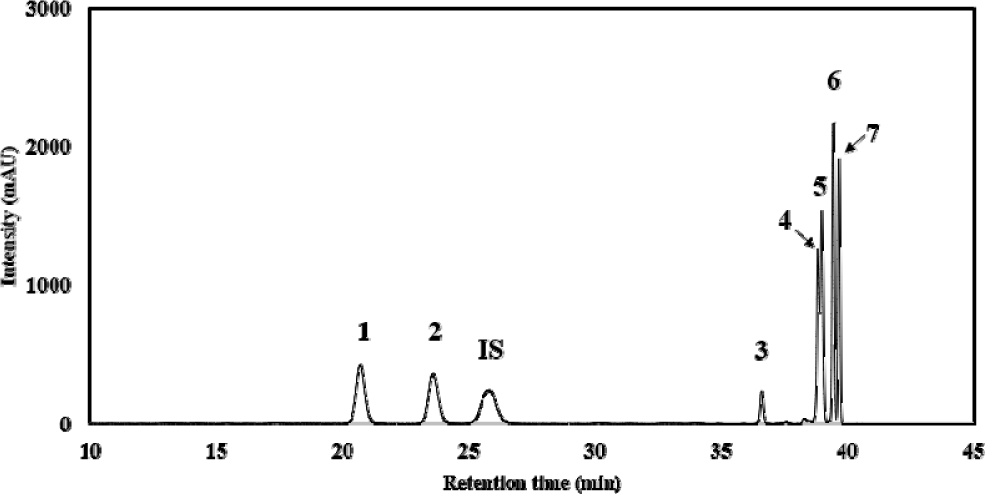
A representative HPLC chromatogram of the standard mixture containing seven carotenoids and an internal standard is shown in Fig. 1. Based on their occurrence and distribution in foods, seven carotenoids, including lutein, zeaxanthin, β-cryptoxanthin, β-carotene, α-carotene, (9Z)-β-carotene, (13Z)-β-carotene, were selected as target analytes. In particular, the cis-isomers of β-carotene were included to provide a more detailed characterization of β-carotene isomer profiles. The seven carotenoids were eluted in the following order: lutein, zeaxanthin, β-cryptoxanthin, (13Z)-β-carotene, α-carotene, β-carotene, and (9Z)-β-carotene. All seven carotenoid standards eluted within 40 min, consistent with previous studies (Hwang et al., 2025; Jung et al., 2025). The limits of detection (LOD) for lutein, zeaxanthin, β- cryptoxanthin, (13Z)-β-carotene, α-carotene, β-carotene, and (9Z)-β- carotene were determined to be 0.751, 0.038, 0.049, 0.284, 0.147, 1.212, and 0.257 μg/mL, respectively. The corresponding limits of quantification (LOQ) were 2.275, 0.116, 0.148, 0.860, 0.447, 3.673, and 0.777 μg/mL, respectively.
A total of 27 agricultural products including tubers, legumes, and teas were analyzed according to food category, species, and sample pre-processing method (Table 1). Carotenoids in the samples were qualitatively and quantitatively analyzed based on HPLC analyses. The quantitative results of carotenoids in all samples analyzed are shown in Table 2. In tubers, carotenoids were not detected in most samples except for taro samples, where trace amounts of lutein were identified (raw, 1.01±0.01 μg/g; boiled, 0.65±0.03 μg/g) (Fig. 2A, B). All other tuber products, including yam and potato-derived samples, exhibited non-detectable carotenoid concentrations. In total, most tuber samples showed no detectable carotenoids, indicating very limited carotenoid accumulation in these matrices.
1) No. is the sample numbers listed in Table 1.
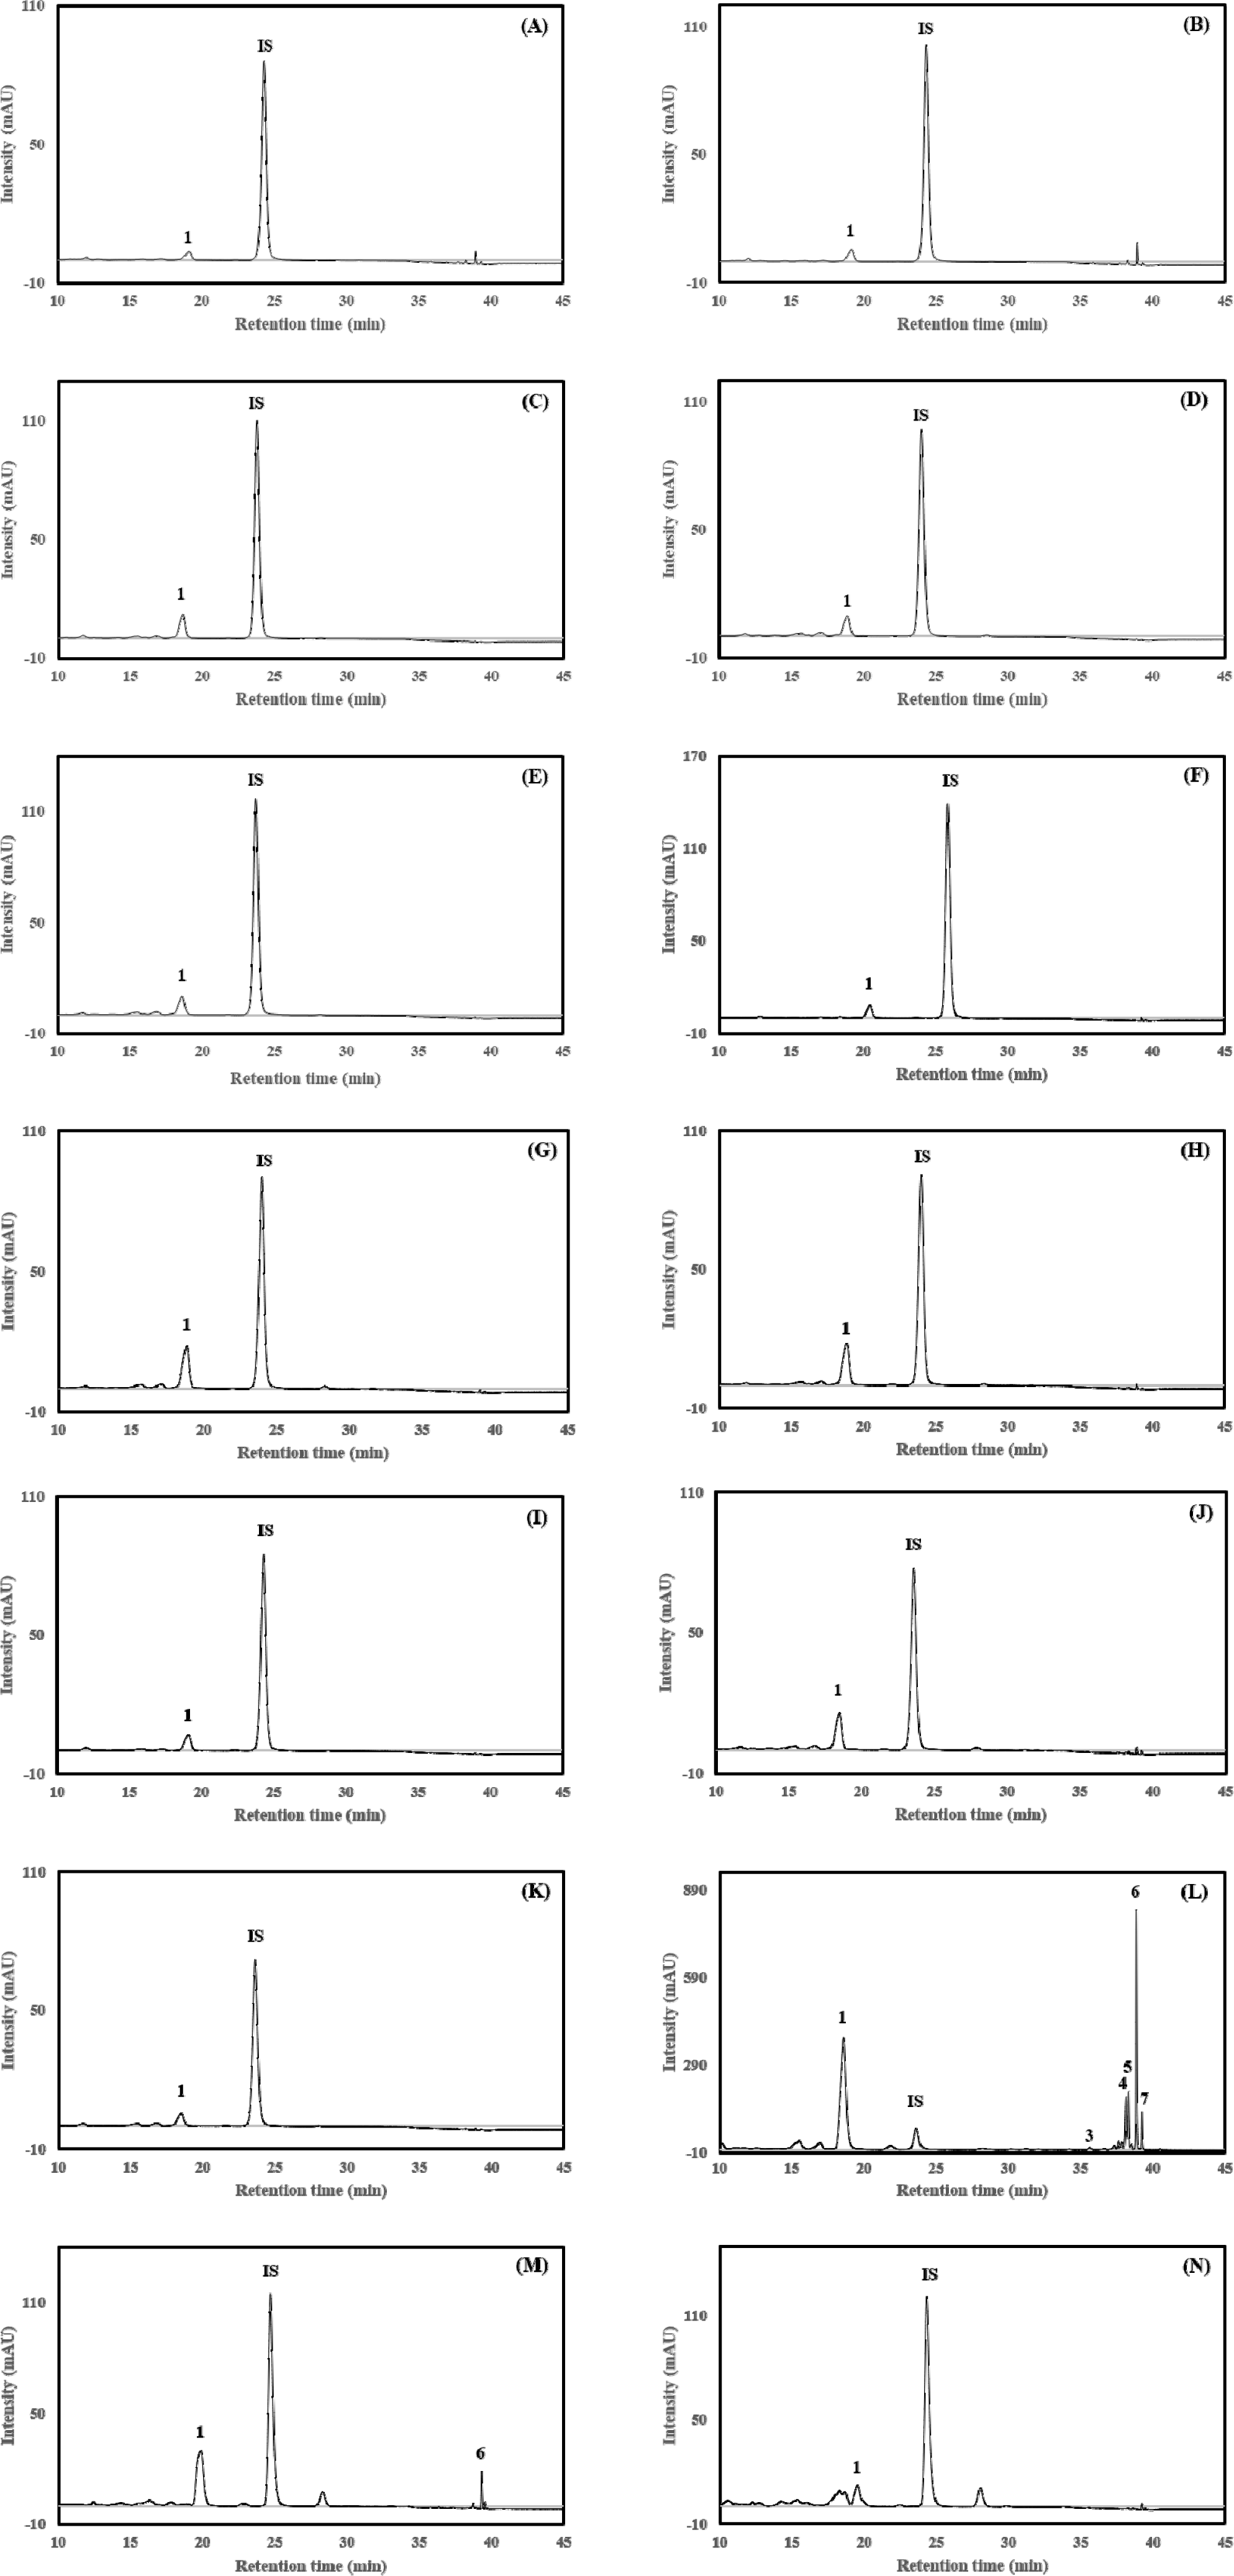
In legumes, carotenoids were detected more frequently than in tubers; however, all detected carotenoids were limited to lutein (Fig. 2C–K). This is consistent with previous studies reporting that lutein is the dominant carotenoid in legumes (Tee et al., 1995). In yellow soybean, lutein was detected in all processing categories, with concentrations ranging from 1.72±0.01 to 2.35±0.20 μg/g DW depending on treatment conditions. In Seoritae (black soybean), lutein was detected in dried, roasted and boiled samples, with the highest concentration observed in boiled samples (5.65±0.18 μg/g) among legumes. Similarly, in Heuktae (black soybean), lutein was detected in all processing categories, with higher levels observed in the roasted samples (5.28±0.16 μg/g).
In tea samples, carotenoids were detected in all samples except for chamomile tea (Fig. 2L–N). Notably, green tea exhibited the highest total carotenoid content among all samples (521.08±2.27 μg/g) and six carotenoids except zeaxanthin were detected, including lutein (360.01±1.65 μg/g), β-cryptoxanthin (10.21±0.09 μg/g), β- carotene (76.91±0.94 μg/g), α-carotene (23.51±0.20 μg/g), (9Z)-β- carotene (15.31±0.12 μg/g), and (13Z)-β-carotene (35.12±0.31 μg/g), which is consistent with previous studies reporting that tea leaves contain various carotenoids including lutein and β-carotene (Suzuki & Shioi, 2003). Following green tea, chrysanthemum flower tea showed a relatively high total carotenoid content (26.94±1.10 μg/g) compared to other teas; however, only lutein was detected. In contrast, Gujeolcho tea contained lutein (17.47±0.50 μg/g) and β- carotene (0.98±0.02 μg/g). Among the three food categories, teas had higher total carotenoid contents than tubers and legumes. Collectively, the quantitative analyses revealed distinct carotenoid distribution patterns among the food categories, with both carotenoid content and diversity being lowest in tuber-derived products, higher in legumes, and greatest in tea samples.
Compared with other food categories, tubers, as well as legumes, showed relatively low carotenoid contents (<6 μg/g DW). This trend was similar to that observed in cereals, where 38 samples, except for barley shoots, exhibited relatively low carotenoid levels (Hwang et al., 2025). This may be attributed to the fact that light and plastid differentiation are key regulators of carotenoid biosynthesis (Quian-Ulloa & Stange, 2021). Since tubers grow underground and legumes are enclosed within pods, their exposure to light is limited, which likely restricts carotenoid biosynthesis. Although carotenoid biosynthesis is generally regulated by light, the accumulation of carotenoids also depends on plastid differentiation. For example, carrot roots accumulate high levels of carotenoids due to the presence of chromoplasts specialized for carotenoid storage, whereas tubers and legumes contain mainly amyloplasts or non-pigmented plastids, resulting in low carotenoid contents (Sun et al., 2018; Choi et al., 2021). As tubers and legumes consist of non-photosynthetic tissues that are not exposed to light, carotenoid biosynthesis is limited, resulting in low carotenoid contents. Compared with tubers and legumes, citrus fruits have been reported to exhibit higher carotenoid contents; however, more than 90% of the total carotenoids are dominated by β-cryptoxanthin (Jung et al., 2025), whereas carotenoid composition in tubers and legumes was primarily limited to lutein.
In addition to differences among food categories, lutein contents in soybean samples differed markedly among cultivars, with additional cultivar-dependent responses to processing treatments (Fig. 3A). Seoritae consistently exhibited relatively high lutein contents across all processing treatments, whereas yellow soybean maintained comparatively low levels. In contrast, within each processing treatment, significant differences among cultivars were observed; in dried samples, Seoritae showed the highest lutein content, followed by yellow soybean and Heuktae, with significant differences among all three cultivars (p<0.05). After roasting, Seoritae and Heuktae exhibited similarly high lutein contents, both significantly higher than that of yellow soybean. After boiling, Seoritae showed a significantly higher lutein content than yellow soybean and Heuktae, whereas the latter two did not differ significantly. Processing effects also differed among cultivars. In yellow soybean, boiling significantly decreased lutein content compared with drying and roasting, whereas roasting and boiling significantly increased lutein contents in Seoritae compared with drying. In Heuktae, roasting resulted in a marked increase in lutein content, while dried and boiled samples showed similarly low levels. These findings suggest that cultivar is an important factor associated with lutein content in soybeans, while the response to thermal processing varies depending on cultivar. Thermal processing may alter carotenoid extractability through disruption or softening of the food matrix, while simultaneously promoting carotenoid degradation (Palermo et al., 2014). Therefore, the observed changes in lutein content likely reflect the balance between enhanced extractability and thermal loss, with the extent of these effects differing among soybean cultivars.
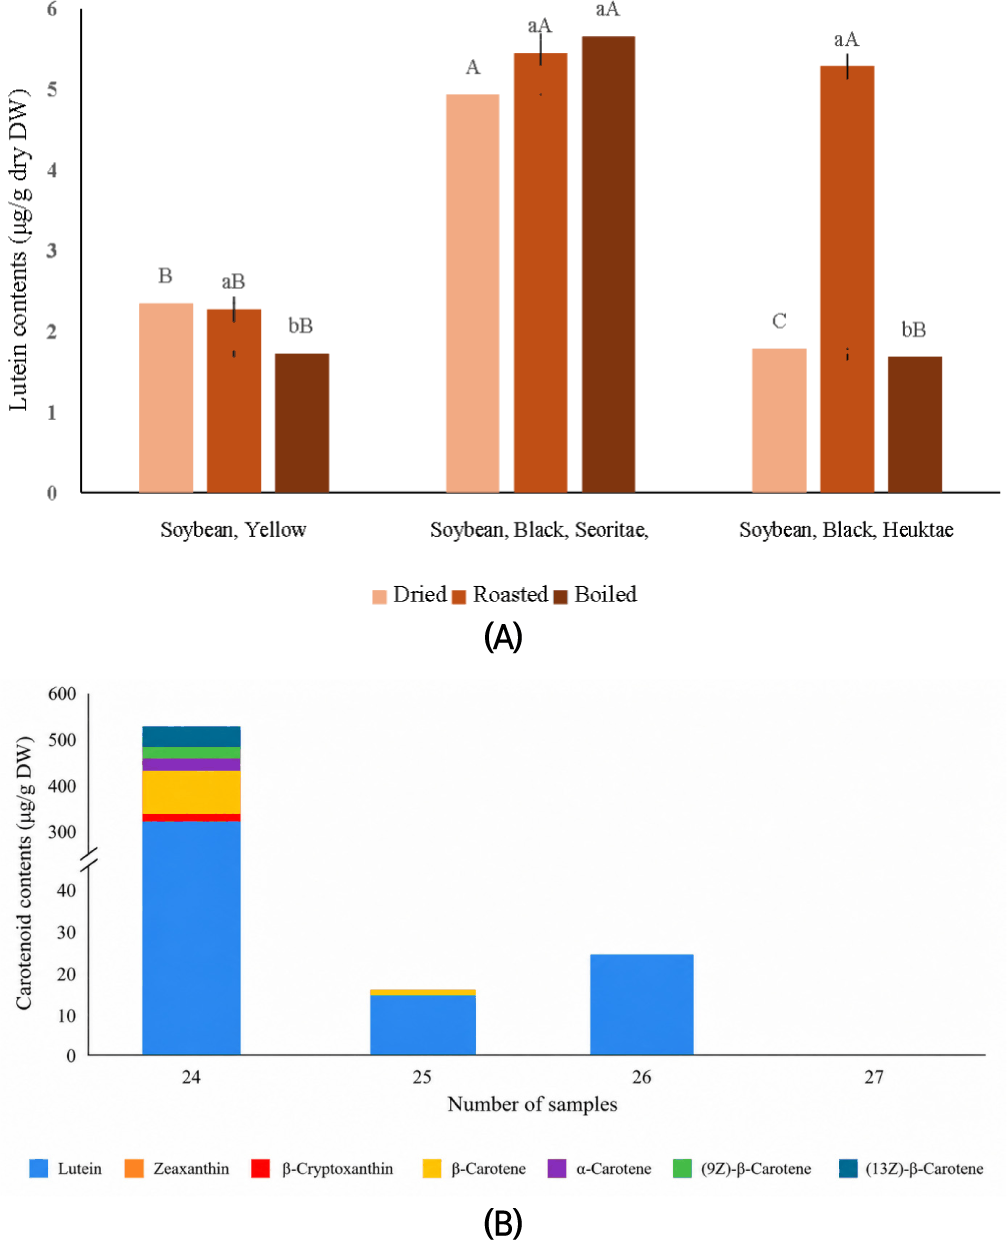
Among the tea samples, marked differences were observed in both carotenoid content and composition (Fig. 3B). Green tea exhibited the most diverse carotenoid profile, with six carotenoids detected, and lutein was the predominant carotenoid, followed by β-carotene. Lutein and β-carotene together accounted for approximately 83.8% of the total carotenoid content in green tea. Gujeolcho tea contained only lutein and β-carotene, which together accounted for 100% of the total carotenoids, whereas chrysanthemum tea contained lutein as the sole detectable carotenoid. These results indicate that lutein was the major carotenoid across the carotenoid-positive tea samples, although the diversity and relative composition of carotenoids differed considerably among tea types. This pattern was similar to that observed in vegetables, where lutein and β-carotene were detected in most samples, contributing substantially to total carotenoid content, with proportions of 33.3–53.6% for lutein and 36.2–52.6% for β-carotene (Hwang et al., 2025; Jung et al., 2025). In contrast, no carotenoids were detected in chamomile tea in this study. This may be associated with differences in sample preparation, as chamomile tea was prepared by infusion in boiling water prior to freeze-drying, whereas the other tea samples were freeze-dried directly from tea leaves. Moreover, the short infusion time (1 min) of chamomile tea might limit the extraction of lipophilic carotenoids, which may explain why carotenoids were not detected.
Conclusion
Distinct differences in carotenoid content and composition were observed among the food categories analyzed in this study. Tubers and legumes generally exhibited low carotenoid levels, with lutein being the predominant or sole detectable carotenoid, whereas tea samples showed higher carotenoid contents and more diverse profiles. In soybean samples, lutein contents differed among cultivars, and variations in carotenoid content were observed among different processing forms depending on the cultivar. Green tea exhibited the greatest carotenoid diversity, while no carotenoids were detected in chamomile tea, under the analytical conditions used in this study. Overall, the observed differences in carotenoid content and composition among food categories may be associated with intrinsic factors, such as tissue type and cultivar, as well as differences in processing methods. These findings provide fundamental data on the carotenoid composition of commonly consumed foods in Korea and may contribute to food composition databases and dietary carotenoid intake assessment.


