
 PDF Download
 PubReader
 Export Citation
 Email the Author
 Share Facebook
 Share Twitter
 Cited by 0 Article
 Metrics (View:30)









Introduction
Carotenoids are naturally occurring lipid-soluble pigments that are widely distributed in plants, algae, and photosynthetic microorganisms (Rodriguez-Concepcion et al., 2018). They are responsible for the yellow, orange, and red colors of many fruits and vegetables and play essential roles in photosynthesis by harvesting light energy and protecting plant tissues against photooxidative damage (Frank & Cogdell, 1996). To date, more than 850 carotenoids have been identified in nature, although only a limited number are commonly present in the human diet (Maoka, 2020). Among these, β-carotene, α-carotene, and β-cryptoxanthin possess provitamin A activity, whereas lutein, zeaxanthin, and lycopene are recognized for their antioxidant properties and their potential roles in maintaining eye health and reducing the risk of chronic diseases (Eggersdorfer & Wyss, 2018; Johra et al., 2020). Owing to these biological functions, carotenoids have attracted considerable attention as important bioactive compounds in nutrition, food science, and human health (Meléndez-Martínez, 2019).
Vegetables are among the most important dietary sources of carotenoids and contribute substantially to the daily intake of these bioactive compounds (Maiani et al., 2009). Green leafy vegetables are particularly rich in xanthophylls such as lutein and zeaxanthin, whereas orange and yellow colored vegetables generally contain higher levels of provitamin A carotenoids, including α-carotene and β-carotene (Mamatha et al., 2011; Walsh et al., 2015). However, the composition and concentration of carotenoids differ considerably among vegetable types because of variations in genetic characteristics, growing conditions, maturity, and postharvest handling (Saini & Keum, 2018). Consequently, the nutritional quality of vegetables is closely associated with both the qualitative and quantitative composition of individual carotenoids (Kopsell & Kopsell, 2006). Characterization of carotenoid profiles in vegetables is therefore essential for evaluating their nutritional value and for providing reliable information to consumers, the food industry, and researchers (Ngamwonglumlert et al., 2020).
Food processing is one of the most important factors affecting the stability and composition of carotenoids in vegetables (Ngamwonglumlert et al., 2020). Among various processing techniques, thermal processing methods, such as blanching, boiling, steaming, and drying, can alter the physicochemical properties of plant tissues and subsequently influence the extractability, degradation, and isomerization of carotenoids (Meléndez-Martínez et al., 2023). In some cases, such thermal treatments increase the extractable carotenoid content by disrupting cell walls and weakening carotenoid-protein complexes, thereby improving extraction efficiency (Palermo et al., 2014). Conversely, excessive heat, prolonged processing, and exposure to oxygen and light may accelerate oxidative degradation and trans-to-cis isomerization, resulting in substantial losses of carotenoids (Saini & Keum, 2018). Therefore, the effects of thermal processing on carotenoid profiles are often complex and depend on both the processing conditions and the characteristics of individual vegetables (Wang et al., 2024).
Previous studies have investigated the effects of food processing on carotenoid composition in fruits and vegetables (Nunn et al., 2006; Hwang & Kim, 2013). However, most previous studies have focused on individual vegetable species or specific processing methods, limiting direct comparisons of carotenoid profiles among vegetables. Furthermore, comprehensive information on how different processing methods influence carotenoid profiles in Korean domestic vegetables remains limited (Jung et al., 2025). A systematic evaluation of processing-induced changes in carotenoid composition is therefore required to provide reliable compositional data and to improve the understanding of the nutritional impacts of food processing.
Based on these considerations, the present study aimed to investigate the effects of different processing methods on carotenoid profiles in Korean domestic vegetables. The carotenoid composition of raw and processed vegetables was analyzed using high-performance liquid chromatography (HPLC), and the changes in individual carotenoids induced by processing were systematically compared. The findings of this study are expected to provide fundamental information for understanding the influence of food processing on carotenoid composition and to contribute to the effective utilization of vegetable resources with improved nutritional quality.
Materials and Methods
A total of 90 raw and processed vegetable samples were analyzed in this study. The samples were provided by the National Institute of Crop and Food Science (Wanju, Korea), Kyungsung University (Busan, Korea), and Kangwon National University (Chuncheon, Korea). The samples comprised a wide range of Korean vegetables in raw or different processed forms. To minimize carotenoid degradation during storage, all samples were freeze-dried at –60°C for at least 48 h, pulverized into a fine powder, and stored at –55°C until carotenoid extraction. The corresponding raw and processed samples of the same vegetable type and plant part are presented in Table 1.
Analytical standards of lutein, zeaxanthin, β-carotene, α-carotene, β-cryptoxanthin, (9Z)-β-carotene, and (13Z)-β-carotene were used for carotenoid identification and quantification. Lutein, zeaxanthin, and β-carotene standards were obtained from Extrasynthese (Genay, France), whereas α-carotene, β-cryptoxanthin, and the internal standard (trans-β-apo-8′-carotenal) were purchased from Sigma-Aldrich (St. Louis, MO, USA). The (9Z)-β-carotene and (13Z)-β-carotene standards were obtained from CaroteNature (Ostermundigen, Switzerland). HPLC-grade methanol, methyl tert-butyl ether (MTBE), ethanol, dichloromethane, n-hexane, toluene, and water were used throughout the analysis. Methanol was purchased from Duksan (Seoul, Korea), MTBE from Fisher Chemical (Waltham, MA, USA), ethanol from Daejung Chemical (Seoul, Korea), and water and n-hexane from Honeywell (Charlotte, NC, USA). Ammonium acetate, ascorbic acid, and dichloromethane were obtained from Sigma-Aldrich, while potassium hydroxide was purchased from FUJIFILM Wako Pure Chemical Corporation (Osaka, Japan).
Individual carotenoid stock solutions were prepared at a concentration of 500 μg/mL using a methanol:dichloromethane (50:50, v/v) solvent mixture and stored at –20°C until use. Calibration standards were freshly prepared by serial dilution of the stock solutions with the same solvent to produce concentrations ranging from 0.049 to 25 μg/mL. The internal standard (trans-β-apo-8′-carotenal) was added to all calibration solutions at a constant concentration of 10 μg/mL.
Carotenoids were extracted following a modified saponification procedure (Park et al., 2014). Briefly, freeze-dried sample powder (10–100 mg) was mixed with 3 mL of ethanol containing 0.1% (w/v) ascorbic acid and incubated in a water bath at 85°C for 5 min. Saponification was subsequently carried out by adding 120 μL of 80% (w/v) potassium hydroxide, followed by incubation at 85°C for 10 min. After cooling on ice, 100 μL of the internal standard solution (25 μg/mL) was added. Carotenoids were extracted twice with a n-hexane:toluene (1:1, v/v) solvent mixture, and the combined organic phase was collected. The solvent was evaporated under a gentle stream of nitrogen, and the residue was reconstituted in 250 μL of methanol:dichloromethane (50:50, v/v). Before HPLC analysis, the extracts were filtered through a 0.5 μm hydrophobic PTFE syringe filter (Advantec, Tokyo, Japan). The final concentration of the internal standard in each extract was adjusted to 10 μg/mL.
Carotenoid separation and quantification were performed on an Agilent 1260 Infinity II HPLC system (Agilent Technologies, Santa Clara, CA, USA) using a modified reverse-phase HPLC method (Park et al., 2014). The system was equipped with a diode array detector, autosampler, column oven, and degasser. Separation was achieved using a YMC C30 analytical column (250 mm×4.6 mm, 3 μm; YMC Co., Ltd., Kyoto, Japan) protected by a Symmetry C18 guard column (3.9 mm×20 mm, 5 μm; Waters, Milford, MA, USA). The C30 stationary phase enabled efficient separation of carotenoid geometric isomers. The mobile phase consisted of (A) methanol/water (92:8, v/v) containing 10 mM ammonium acetate and (B) 100% methyl tert-butyl ether. Gradient elution was performed at a flow rate of 1.0 mL/min as follows: 0–20 min, 10–17% B; 20–29 min, 17–25% B; 29–35 min, 25–70% B; 35–40 min, 70% B; and 40–42 min, 70–75% B, followed by column re-equilibration. The column temperature was maintained at 40°C, and the injection volume was 20 μL. Chromatograms were monitored at 450 nm. Carotenoids were identified by comparing their retention times and UV-visible absorption spectra with those of authentic standards. Quantification was performed using ten-point calibration curves (0.049–25 μg/mL) with internal standardization. The limits of detection (LOD) and quantification (LOQ) for each carotenoid were calculated using LOD=3.3σ/S and LOQ=10σ/S, where σ represents the standard deviation of the y-intercepts obtained from three calibration curves and S represents the mean slope of the calibration curves.
A heatmap was generated to visualize the distribution of seven individual carotenoids across the 90 raw and processed vegetable samples. Carotenoid contents (μg/g dry weight, DW) were transformed using log10(1+x), where x represents the carotenoid content, and displayed using a color gradient, with darker blue indicating higher contents. Not-detected (ND) carotenoids were assigned a value of 0 and displayed in white. For comparison of carotenoid composition, the mean content of each carotenoid was calculated separately for each processing group and its corresponding matched raw samples. The relative proportion of each carotenoid was calculated as its mean content divided by the sum of the mean contents of the seven identified carotenoids and expressed as a percentage. ND values were treated as 0 in this calculation.
All analyses were performed using three independent sample preparation replicates, and the data are expressed as mean±standard deviation (SD).
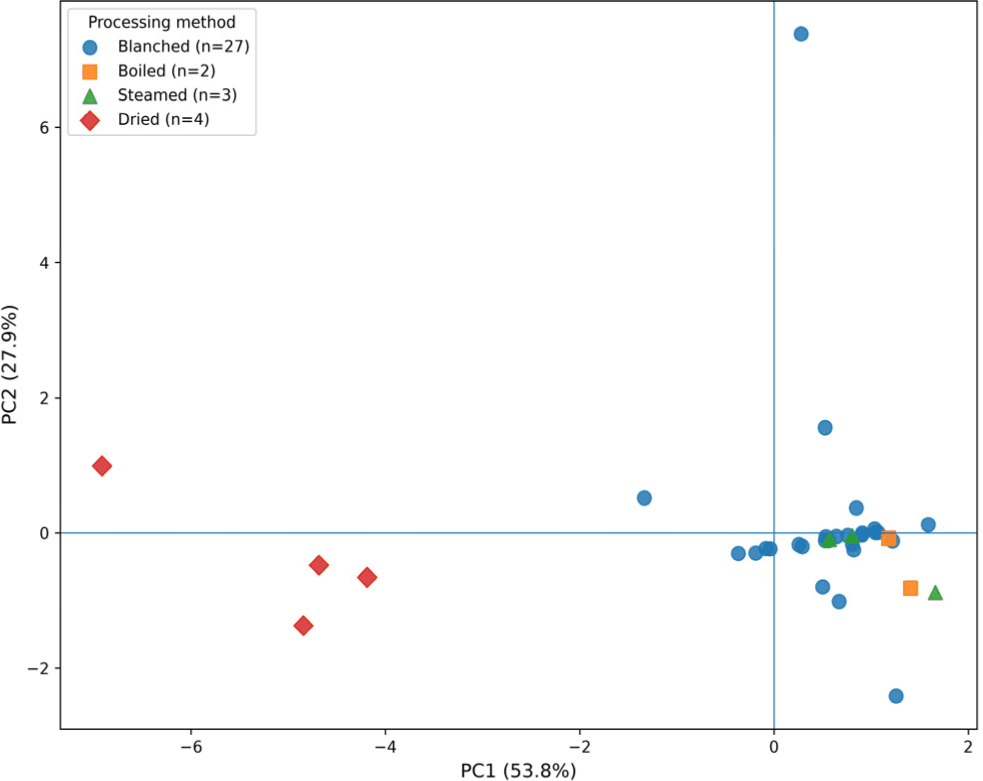
To evaluate overall patterns of processing-induced changes in carotenoid contents, principal component analysis (PCA) was performed using only matched raw and processed samples of the same vegetable type and plant part. A total of 36 matched pairs were included: blanched (n=27), boiled (n=2), steamed (n=3), and dried (n=4). For each carotenoid, the processing-induced change was calculated as log10 (1 + processed content) – log10 (1 + raw content). The changes in the seven carotenoids were standardized to a mean of 0 and a standard deviation of 1 prior to PCA. PCA score and loading plots were generated to visualize the distribution of samples according to processing method and the contribution of individual carotenoids to the principal components, respectively.
Results and Discussion
A total of 90 raw and processed vegetable samples were analyzed for their carotenoid composition. The samples were assigned identification numbers according to vegetable type and processing method, as summarized in Table 1. HPLC was used to quantify the carotenoid contents; the elution order was lutein, zeaxanthin, β-cryptoxanthin, (13Z)-β-carotene, α-carotene, β-carotene, and (9Z)-β-carotene. The LOD values for lutein, zeaxanthin, β-cryptoxanthin, 13Z-β-carotene, α-carotene, β-carotene, and 9Z-β-carotene were 0.751, 0.038, 0.049, 0.284, 0.147, 1.212, and 0.257 μg/mL, respectively, while the corresponding LOQ values were 2.275, 0.116, 0.148, 0.860, 0.447, 3.673, and 0.777 μg/mL, respectively. All carotenoid peaks were completely resolved within 40 min, and the quantitative results are presented in Table 2. The distribution of individual carotenoid contents across the 90 samples was visualized using a heatmap (Fig. 1). Considerable variation was observed in both the abundance and composition of carotenoids among the analyzed samples.
1) No is the sample numbers listed in Table 1.
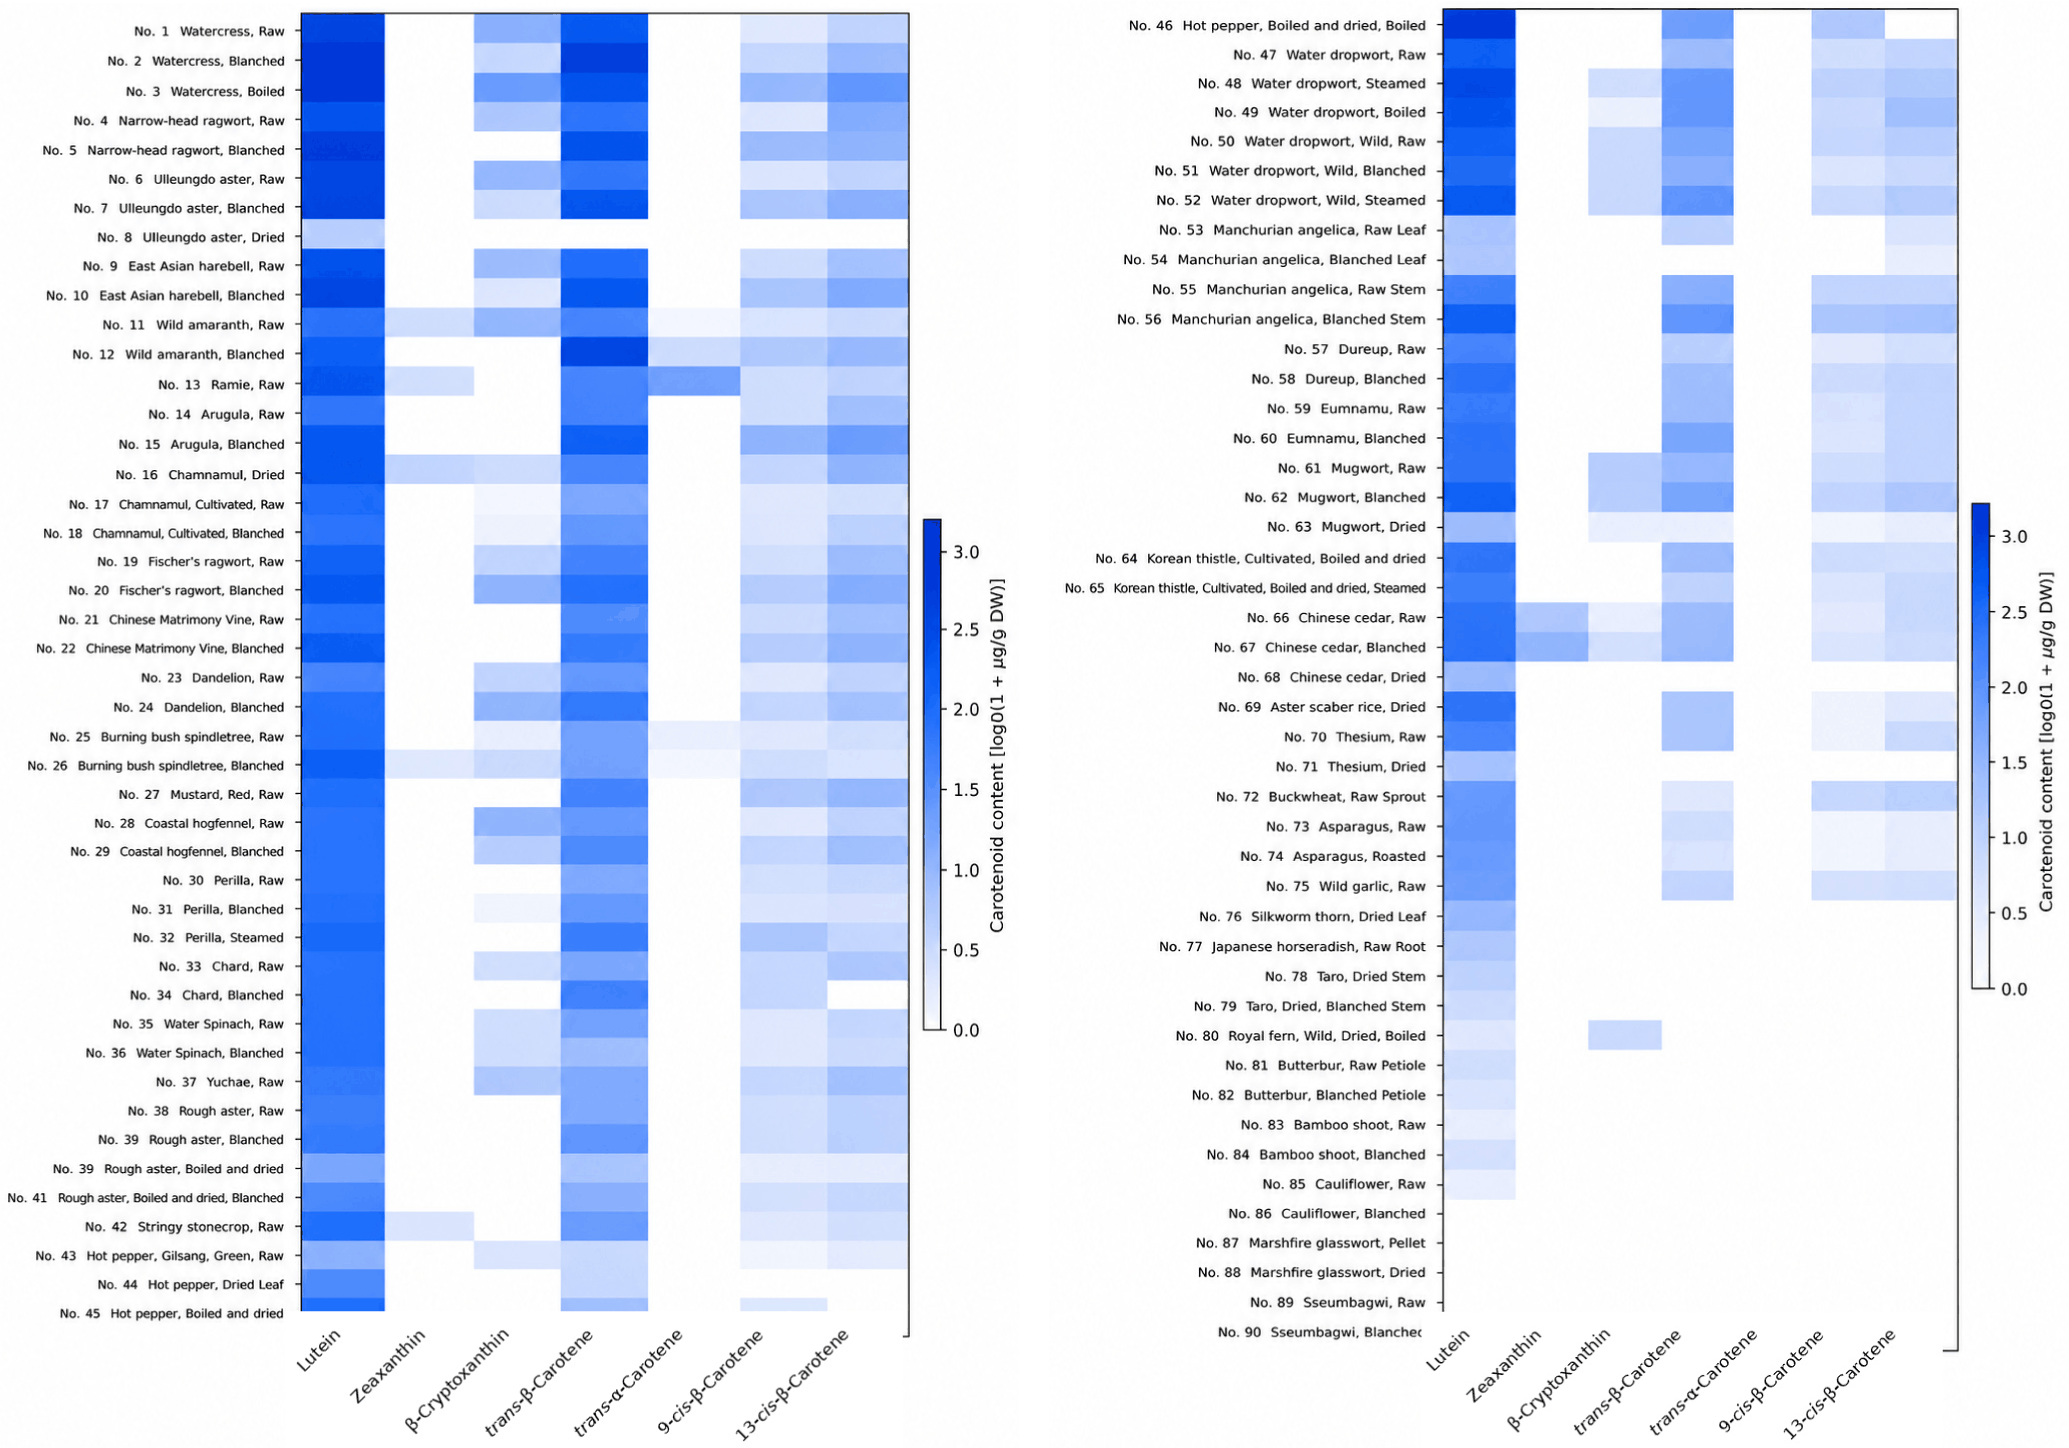
Overall, lutein and trans-β-carotene were broadly distributed and represented the predominant carotenoids in many samples, whereas the other carotenoids showed more variable and sample-specific distribution patterns (Fig. 1). Carotenoid profiles also differed among vegetable types and processing conditions, with some samples containing multiple carotenoids and others exhibiting relatively simple profiles dominated by lutein and trans-β-carotene. These differences demonstrate the substantial diversity of carotenoid profiles among the analyzed vegetables and provide a basis for further comparison of carotenoid contents and processing-induced changes.
Considerable variation in total carotenoid contents was observed among the analyzed vegetables (Table 2), consistent with the differences in carotenoid profiles visualized in the heatmap (Fig. 1). Among the analyzed samples, watercress exhibited the highest total carotenoid content, followed by narrow-head ragwort and ulleungdo aster. Overall, vegetables with high total carotenoid contents were predominantly leafy vegetables.
The high total carotenoid contents of these vegetables were primarily associated with their elevated lutein and trans-β-carotene concentrations. Lutein was the predominant carotenoid in the highest-ranking vegetables, ranging from 1,164.40 to 1,669.90 μg/g DW, whereas trans-β-carotene was consistently detected as the second most abundant carotenoid. The high carotenoid contents observed in these vegetables are likely attributable to the greater accumulation of carotenoids in chloroplast-rich leaf tissues (Znidarčič et al., 2011; Domonkos et al., 2013). Similar observations have been reported previously, with lutein and β-carotene consistently identified as the major carotenoids in green leafy vegetables (Serrano et al., 2005; Raju et al., 2007). This predominance is consistent with the localization of carotenoids in photosynthetic tissues, where they are closely associated with the photosynthetic apparatus and contribute to light harvesting and photoprotection (Domonkos et al., 2013; Cazzaniga et al., 2016).
Thermal processing affected total carotenoid contents differently depending on vegetable types and processing method. Blanching generally resulted in higher total carotenoid contents in several leafy vegetables, although both increases and decreases were observed after processing.
Among the vegetables showing increased carotenoid contents after blanching, watercress exhibited the highest value (2,421.09 μg/g DW) compared with 1,783.47 μg/g DW in the corresponding raw sample. Boiled watercress also maintained a high total carotenoid content (2,329.65 μg/g DW). Similar increases following blanching were observed in narrow-head ragwort (2,103.34 μg/g DW), ulleungdo aster (1,811.53 μg/g DW), and wild amaranth (1,722.18 μg/g DW). These increases may be attributable to enhanced carotenoid extractability resulting from disruption of plant cell walls and dissociation of carotenoid-protein complexes during thermal processing (Fratianni et al., 2021). Previous studies have similarly suggested that moderate heat treatment can enhance carotenoid extractability while minimizing thermal degradation (Jacob et al., 2010). Therefore, an increase in analytically determined carotenoid content after processing does not necessarily indicate de novo formation of carotenoids, but may instead reflect improved recovery from the disrupted vegetable matrix (Meléndez-Martínez et al., 2023).
In contrast to the increases described above, several vegetables exhibited reduced carotenoid contents following blanching. For example, the total carotenoid content of wild water dropwort decreased from 613.76 μg/g DW in the raw sample to 543.05 μg/g DW after blanching. Similar reductions were observed in manchurian angelica stem (14.69 to 12.28 μg/g DW) and butterbur petiole (9.19 to 6.14 μg/g DW). These contrasting responses under the same blanching treatment indicate that the effects of blanching depend not only on the processing method but also on the intrinsic characteristics of individual vegetables. Such differences may be associated with variations in tissue structure and the thermal stability of individual carotenoids (Palmero M et al., 2014; Palmero P et al., 2014; Fratianni et al., 2021). The observed reductions in carotenoid contents are likely attributable to thermal and oxidative degradation during processing. Carotenoids are susceptible to structural changes during processing, including oxidative degradation and E/Z isomerization, and their stability can differ according to carotenoid structure and processing conditions (Honda, 2022; Meléndez-Martínez et al., 2023). Therefore, the decreases observed in some vegetables may reflect a predominance of degradation over the improvement in extractability produced by tissue disruption.
Drying exerted variable effects on carotenoid contents depending on the vegetable. The total carotenoid content of chamnamul increased from 863.42 μg/g DW in the raw sample to 1,435.06 μg/g DW after drying, which may reflect enhanced carotenoid extractability associated with structural changes in the vegetable matrix during drying (Zhang et al., 2018). In contrast, marked reductions were observed in several other vegetables. The total carotenoid content of ulleungdo aster decreased from 1,700.91 to 340.83 μg/g DW, while those of chinese cedar and mugwort decreased from 503.66 to 52.40 μg/g DW and from 560.13 to 91.32 μg/g DW, respectively. These contrasting responses suggest that structural changes induced by drying may enhance carotenoid extractability in some vegetables (Zhang et al., 2018), whereas prolonged exposure to heat during drying may promote carotenoid degradation in others (Ouyang et al., 2022). Previous studies have similarly reported that carotenoid retention during drying varies according to drying conditions and the structural characteristics of individual vegetables (Raut et al., 2021; Holden et al., 2024).
To evaluate the overall patterns of carotenoid changes associated with processing, PCA was performed using changes in carotenoid contents between matched raw and processed samples. The first two principal components (PC1 and PC2) explained 53.8% and 27.9% of the total variance, respectively, accounting for 81.7% of the variance (Fig. 2). The PCA score plot showed that dried samples were predominantly distributed in the negative direction of PC1, whereas most blanched, boiled, and steamed samples were distributed in the positive direction. These results indicate that the overall pattern of carotenoid changes associated with drying differed from those observed for the other processing methods.
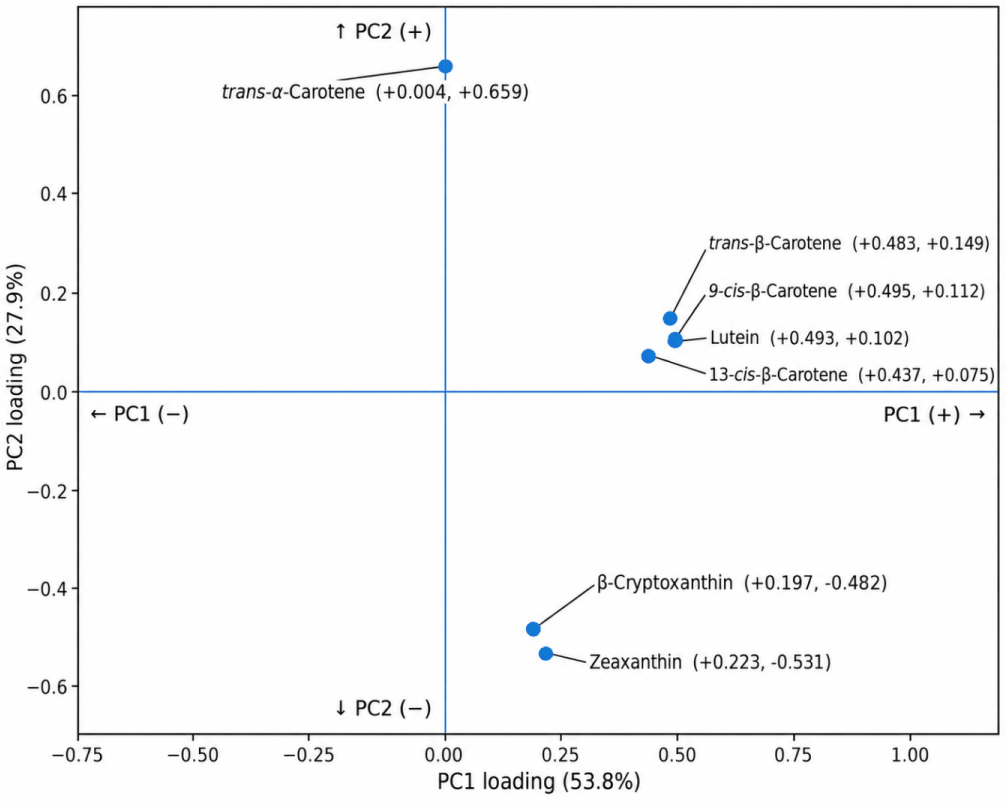
The PCA loading plot further identified the individual carotenoids contributing to the patterns observed in the score plot (Fig. 3). Lutein, trans-β-carotene, 9-cis-β-carotene, and 13-cis-β-carotene showed relatively high positive loadings on PC1, indicating that changes in these carotenoids contributed strongly to the distribution of samples along PC1. In contrast, PC2 was characterized by a positive loading of trans-α-carotene and negative loadings of zeaxanthin and β-cryptoxanthin. These loading patterns indicate that PC1 was mainly associated with coordinated changes in lutein and β-carotene isomers, whereas PC2 reflected differences in the changes of trans-α-carotene, zeaxanthin, and β-cryptoxanthin.
The mean carotenoid composition of each processing group was compared with that of the corresponding matched raw samples to further examine processing-related changes in carotenoid composition (Fig. 4). Lutein accounted for the largest proportion of total carotenoids in all groups, followed generally by trans-β-carotene. Relatively small differences in carotenoid composition were observed between the matched raw and processed samples for blanching, boiling, and steaming. In contrast, drying resulted in a pronounced compositional shift: the mean proportion of lutein increased from 68.8% in the matched raw samples to 87.0% after drying, whereas that of trans-β-carotene decreased from 19.3% to 5.4%. These results indicate that the relative composition of individual carotenoids was altered more markedly by drying than by the other processing methods.
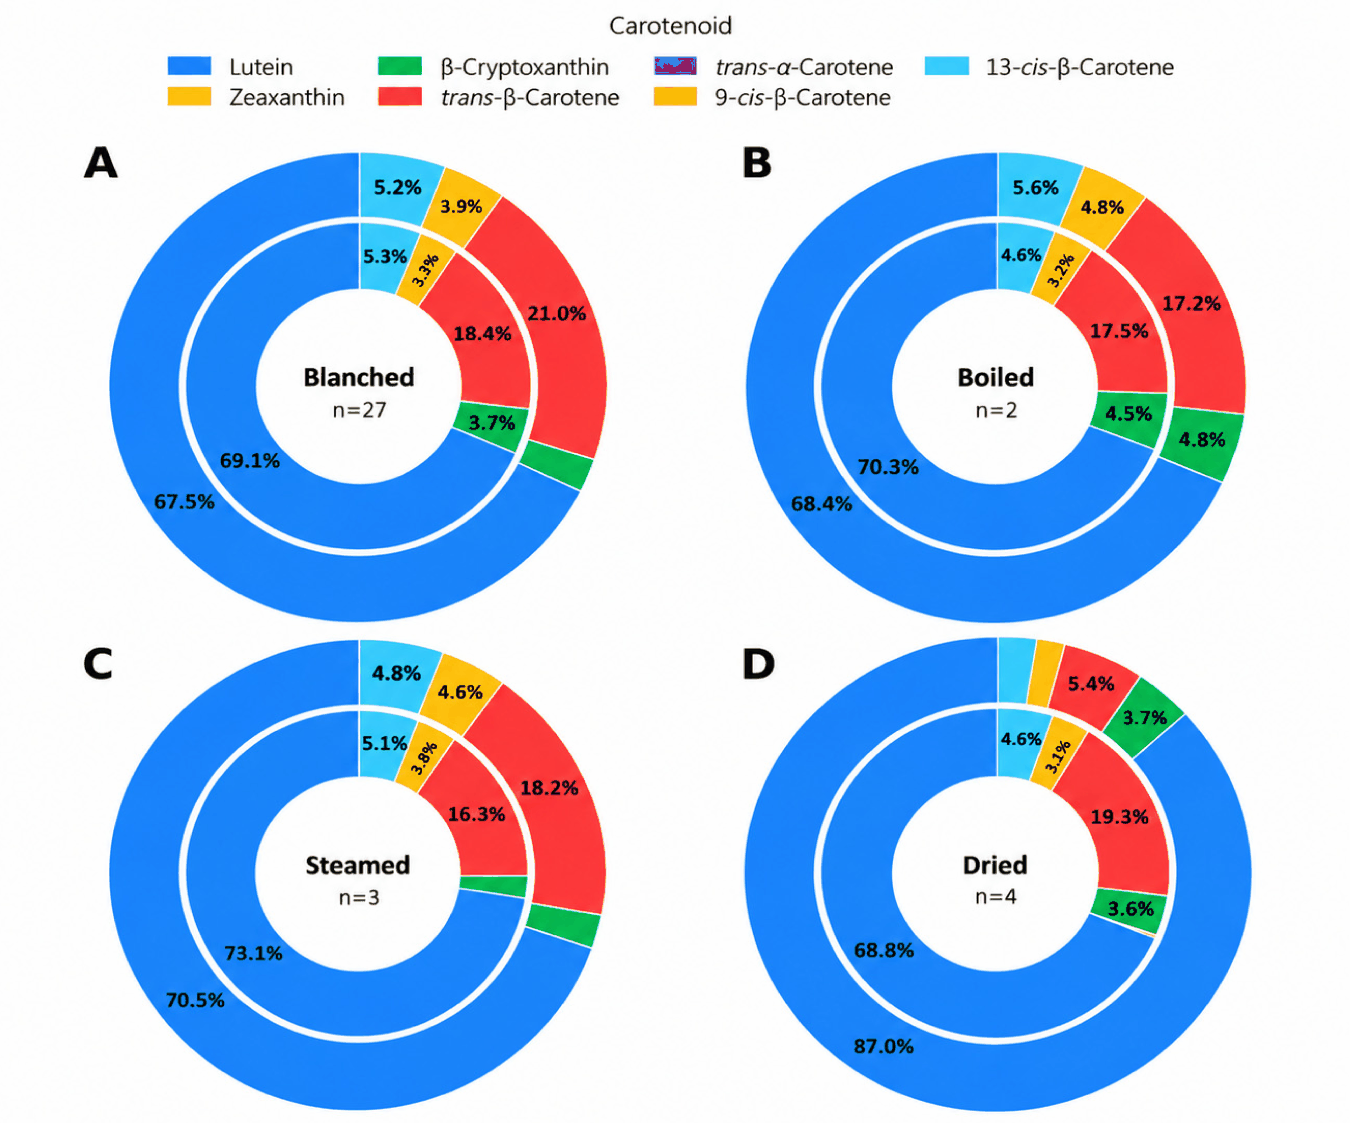
However, because the number and vegetable composition of matched samples differed among processing groups, particularly for boiling, steaming, and drying, these patterns should be interpreted as trends observed within the samples included in this study rather than as general effects of the respective processing methods.
Overall, changes in carotenoid contents following thermal processing varied according to both processing method and vegetable types. In addition, carotenoid contents were expressed on a dry-weight basis, the observed changes in carotenoid contents do not reflect actual nutrient retention during processing. Individual vegetables showed contrasting responses even to the same processing treatment, indicating that processing-induced changes in carotenoid contents are strongly influenced by the intrinsic characteristics of each vegetable. The multivariate analysis further revealed that drying exhibited an overall carotenoid change pattern different from those of blanching, boiling, and steaming (Fig. 2), together with a marked shift in mean carotenoid composition (Fig. 4). These findings suggest that the effects of processing on vegetable carotenoids result from the combined influence of changes in extractability and carotenoid stability, with their relative contributions varying according to vegetable characteristics and processing conditions.
The distribution of individual carotenoids varied considerably among the 90 vegetable samples, as also visualized in the heatmap (Fig. 1). Lutein was the most widely distributed carotenoid, being detected in 85 of the 90 samples, followed by trans-β-carotene (72 samples), 9-cis-β-carotene (70 samples), and 13-cis-β-carotene (69 samples). In contrast, β-cryptoxanthin was detected in 40 samples, whereas zeaxanthin and trans-α-carotene showed highly restricted distributions, occurring in only seven and five samples, respectively. Capsanthin and lycopene were not detected in any of the analyzed samples. Overall, these results indicate a clear difference in the distribution of individual carotenoids among the vegetables.
The concentrations of 9-cis-β-carotene and 13-cis-β-carotene were generally lower than that of trans-β-carotene, although these cis-isomers were widely distributed among the analyzed samples. The highest concentrations of both 9-cis-β-carotene (100.40 μg/g DW) and 13-cis-β-carotene (130.46 μg/g DW) were observed in boiled watercress. The widespread occurrence of both trans- and cis-β-carotene observed in the present study is noteworthy because carotenoid isomerization can occur naturally in plant tissues as well as during food processing (Schieber & Carle, 2005). Previous studies have demonstrated that thermal processing can promote E/Z isomerization of carotenoids, including the conversion of all-trans-β-carotene to cis forms (Lemmens et al., 2010). Thus, the occurrence of 9-cis- and 13-cis-β-carotene across the analyzed samples may reflect their natural occurrence in vegetables, with processing potentially contributing to their presence in processed samples.
Among the carotenoids with more restricted distributions, β-cryptoxanthin showed its highest concentration in boiled watercress (134.99 μg/g DW), whereas the highest zeaxanthin concentration was observed in blanched Chinese cedar (36.78 μg/g DW). Trans-α-carotene, which showed the most limited distribution among the detected carotenoids, reached its highest concentration in raw ramie leaves (73.37 μg/g DW). The restricted occurrence of these carotenoids compared with lutein and β-carotene suggests greater species- or sample-specificity in their distribution. Such variation is consistent with the substantial diversity of carotenoid composition reported among plant foods (Suttisansanee et al., 2023; Jung et al., 2025) and highlights the importance of considering individual carotenoid profiles in addition to total carotenoid content when characterizing vegetable carotenoid composition.
Conclusion
This study characterized the contents and distribution of individual carotenoids in 90 raw and processed vegetable samples consumed in Korea. Considerable variation was observed in carotenoid contents and composition among the analyzed vegetables, with leafy vegetables generally exhibiting relatively high carotenoid contents. Lutein was the most widely distributed carotenoid, followed by trans-β-carotene and the cis-isomers of β-carotene, whereas β-cryptoxanthin, zeaxanthin, and trans-α-carotene showed more restricted distributions. Processing-induced changes in carotenoid contents varied according to both processing method and vegetable types. In particular, multivariate analysis showed that drying exhibited a carotenoid change pattern different from those of blanching, boiling, and steaming, accompanied by a marked shift in mean carotenoid composition. These findings indicate that changes in carotenoid contents during processing are influenced by both processing conditions and the intrinsic characteristics of individual vegetables. The resulting data provide useful information on the carotenoid composition of vegetables and may contribute to the expansion of food composition databases with carotenoid data for Korean agricultural products.


